Compute server logging
The logs on the compute nodes, or any server running nova-compute (for example in a hyperconverged architecture), are the primary points for troubleshooting issues with the hypervisor and compute services. Additionally, operating system logs can also provide useful information.
As the cloud environment grows, the amount of log data increases exponentially. Enabling debugging on either the OpenStack services or the operating system further compounds the data issues.
Logging is described in more detail in the Logging and Monitoring. However, it is an important design consideration to take into account before commencing operations of your cloud.
OpenStack produces a great deal of useful logging information, but for the information to be useful for operations purposes, you should consider having a central logging server to send logs to, and a log parsing/analysis system such as Elastic Stack [formerly known as ELK].
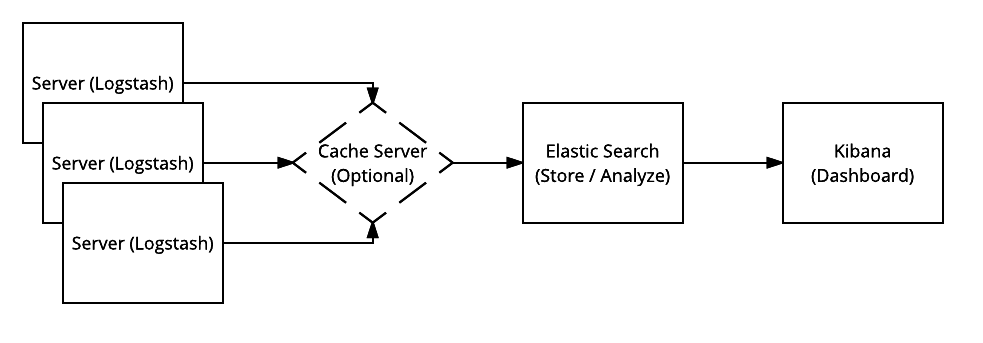
Elastic Stack consists of mainly three components: Elasticsearch (log search and analysis), Logstash (log intake, processing and output) and Kibana (log dashboard service).

Due to the amount of logs being sent from servers in the OpenStack environment, an optional in-memory data structure store can be used. Common examples are Redis and Memcached. In newer versions of Elastic Stack, a file buffer called Filebeat is used for a similar purpose but adds a “backpressure-sensitive” protocol when sending data to Logstash or Elasticsearch.
Log analysis often requires disparate logs of differing formats. Elastic Stack (namely Logstash) was created to take many different log inputs and transform them into a consistent format that Elasticsearch can catalog and analyze. As seen in the image above, the process of ingestion starts on the servers by Logstash, is forwarded to the Elasticsearch server for storage and searching, and then displayed through Kibana for visual analysis and interaction.
For instructions on installing Logstash, Elasticsearch and Kibana, see the Elasticsearch reference.
There are some specific configuration parameters that are needed to configure Logstash for OpenStack. For example, in order to get Logstash to collect, parse, and send the correct portions of log files to the Elasticsearch server, you need to format the configuration file properly. There are input, output and filter configurations. Input configurations tell Logstash where to receive data from (log files/forwarders/filebeats/StdIn/Eventlog), output configurations specify where to put the data, and filter configurations define the input contents to forward to the output.
The Logstash filter performs intermediary processing on each event. Conditional filters are applied based on the characteristics of the input and the event. Some examples of filtering are:
grok
date
csv
json
There are also output filters available that send event data to many different destinations. Some examples are:
csv
redis
elasticsearch
file
jira
nagios
pagerduty
stdout
Additionally there are several codecs that can be used to change the data representation of events such as:
collectd
graphite
json
plan
rubydebug
These input, output and filter configurations are typically stored in
/etc/logstash/conf.d but may vary by linux distribution. Separate
configuration files should be created for different logging systems such as
syslog, Apache, and OpenStack.
General examples and configuration guides can be found on the Elastic Logstash Configuration page.
OpenStack input, output and filter examples can be found at sorantis/elkstack.
Once a configuration is complete, Kibana can be used as a visualization tool for OpenStack and system logging. This will allow operators to configure custom dashboards for performance, monitoring and security.
