6.3.1. Results of measuring performance of Docker Registry
| Abstract: | This document includes performance test results of Docker Registry2 service as a repository of docker images. All test have been performed regarding Measuring performance of container repositories |
|---|
6.3.1.1. Environment description
6.3.1.1.1. Hardware configuration of each server
| server | name | 728998-comp-disk-228 | 728998-comp-disk-227 |
| role | test_tool | registry | |
| vendor,model | HP,DL380 Gen9 | HP,DL380 Gen9 | |
| operating_system | 3.13.0-76-generic
Ubuntu-trusty
x86_64
|
3.13.0-76-generic
Ubuntu-trusty
x86_64
|
|
| CPU | vendor,model | Intel,E5-2680 v3 | Intel,E5-2680 v3 |
| processor_count | 2 | 2 | |
| core_count | 12 | 12 | |
| frequency_MHz | 2500 | 2500 | |
| RAM | vendor,model | HP,752369-081 | HP,752369-081 |
| amount_MB | 262144 | 262144 | |
| NETWORK | interface_name | p1p1 | p1p1 |
| vendor,model | Intel,X710 Dual Port | Intel,X710 Dual Port | |
| bandwidth | 10G | 10G | |
| STORAGE | dev_name | /dev/sda | /dev/sda |
| vendor,model | raid10 - HP P840
12 disks EH0600JEDHE
|
raid10 - HP P840
12 disks EH0600JEDHE
|
|
| SSD/HDD | HDD | HDD | |
| size | 3,6TB | 3,6TB |
6.3.1.1.2. Network scheme and part of configuration of hardware network switches
Network scheme of the environment:
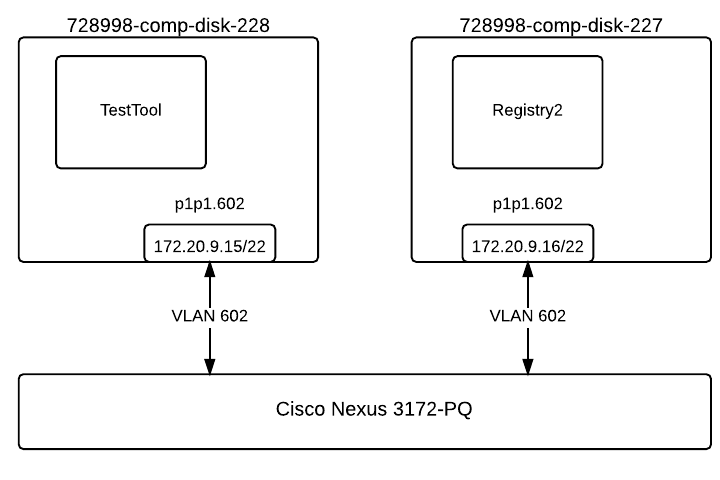
Here is the part of switch configuration for each switch port which connected to p1p1 interface of a server:
switchport mode trunk
switchport trunk native vlan 600
switchport trunk allowed vlan 600-602,630-649
spanning-tree port type edge trunk
spanning-tree bpduguard enable
no snmp trap link-status
6.3.1.1.3. Software configuration of the DockerRegistry service
6.3.1.1.3.1. Installation of Registry2:
echo "deb https://apt.dockerproject.org/repo ubuntu-trusty main" > /etc/apt/sources.list.d/docker.list
apt-get update && apt-get -y install docker-engine
service docker restart
docker run -d -p 5000:5000 --name registry registry:2
| Software | Version |
|---|---|
| Ubuntu | Ubuntu 14.04.3 LTS |
| Registry |
6.3.1.1.3.2. Operating system configuration:
You can find outputs of some commands and /etc folder in the following archive:
6.3.1.1.4. Software configuration of the node with test tool
6.3.1.1.4.1. Test tool:
Firstly we need to install docker-engine:
echo "deb https://apt.dockerproject.org/repo ubuntu-trusty main" > /etc/apt/sources.list.d/docker.list
apt-get update && apt-get -y install docker-engine
echo DOCKER_OPTS=\"--insecure-registry 172.20.9.16:5000\" >> /etc/default/docker
service docker restart
We use Python2.7 and Script for collecting performance metrics with Proposed docker file to perform the tests. The image size is a sum of layers:
IMAGE               CREATED              CREATED BY                                      SIZE                COMMENT
93333b8ed564        About a minute ago   /bin/sh -c #(nop) CMD ["/bin/sh" "-c" "/usr/s   0 B
35d8142196c0        About a minute ago   /bin/sh -c #(nop) EXPOSE 80/tcp                 0 B
3a63f30ab247        About a minute ago   /bin/sh -c apt-get install -y nginx             18.14 MB
97434d46f197        2 days ago           /bin/sh -c #(nop) CMD ["/bin/bash"]             0 B
<missing>           2 days ago           /bin/sh -c sed -i 's/^#\s*\(deb.*universe\)$/   1.895 kB
<missing>           2 days ago           /bin/sh -c set -xe   && echo '#!/bin/sh' > /u   194.5 kB
<missing>           2 days ago           /bin/sh -c #(nop) ADD file:e01d51d39ea04c8efb   187.8 MB
It means that DATA_SIZE=206.13 MB
| Software | Version |
|---|---|
| Ubuntu | Ubuntu 14.04.3 LTS |
| Docker | 1.10 |
6.3.1.1.4.2. Operating system:
You can find outputs of some commands and /etc folder in the following archive:
server_description_of_728997-comp-disk-228.tar.gz
6.3.1.2. Testing process
Registry2 was installed on top of 728998-comp-disk-227 server as described in Installation of Registry2: section.
The values of the variables in test-repo.py script was changed: iterations = 1000 concurrency = 1 repo_address = “172.20.9.16:5000”
The following command was executed to perform the tests:
sudo python test-repo.py
push_results.csv and pull_results.csv was saved in persistent folder.
The steps from 1 to 4 was repeated with the following values of the concurrency parameters: 1,10,30,50,100
As a result of this part we got the following CSV files:
PUSH_TIME(CONCURRENCY=1)
PUSH_TIME(CONCURRENCY=10)
PUSH_TIME(CONCURRENCY=30)
PUSH_TIME(CONCURRENCY=50)
PUSH_TIME(CONCURRENCY=100)
PULL_TIME(CONCURRENCY=1)
PULL_TIME(CONCURRENCY=10)
PULL_TIME(CONCURRENCY=30)
PULL_TIME(CONCURRENCY=50)
PULL_TIME(CONCURRENCY=100)
6.3.1.3. Results
6.3.1.3.1. Push action results
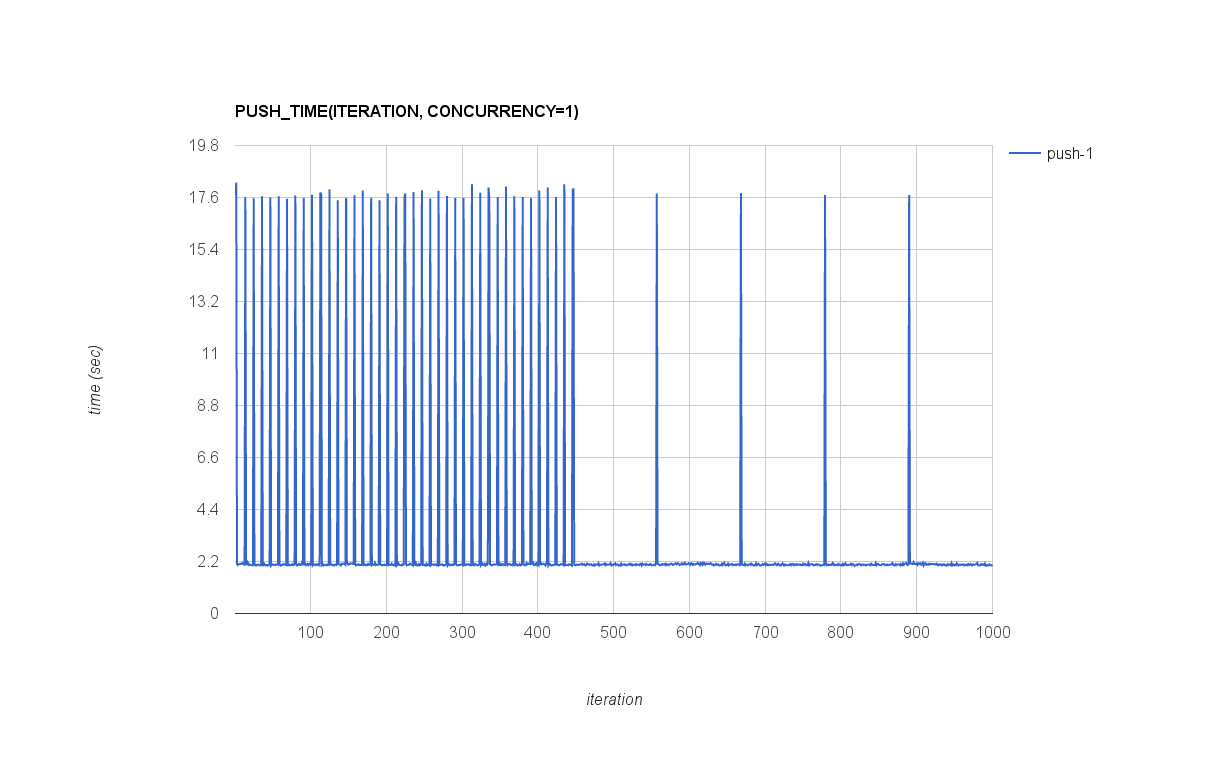
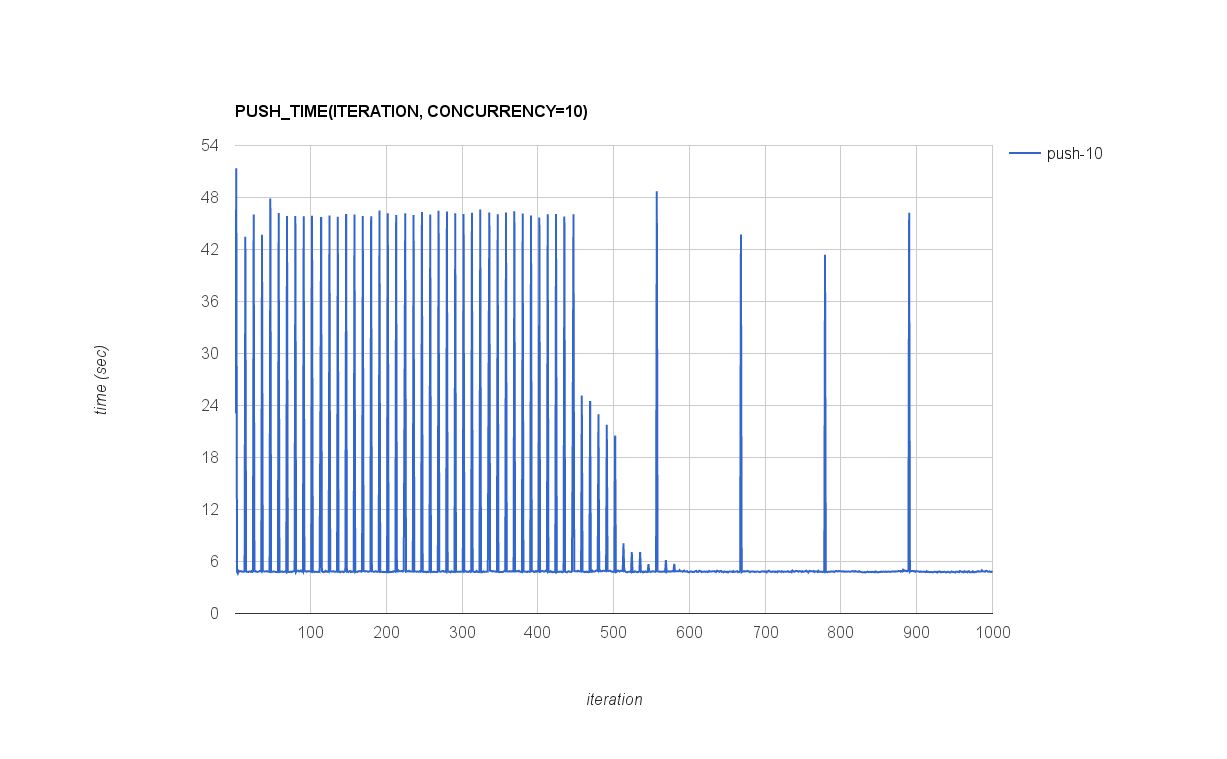
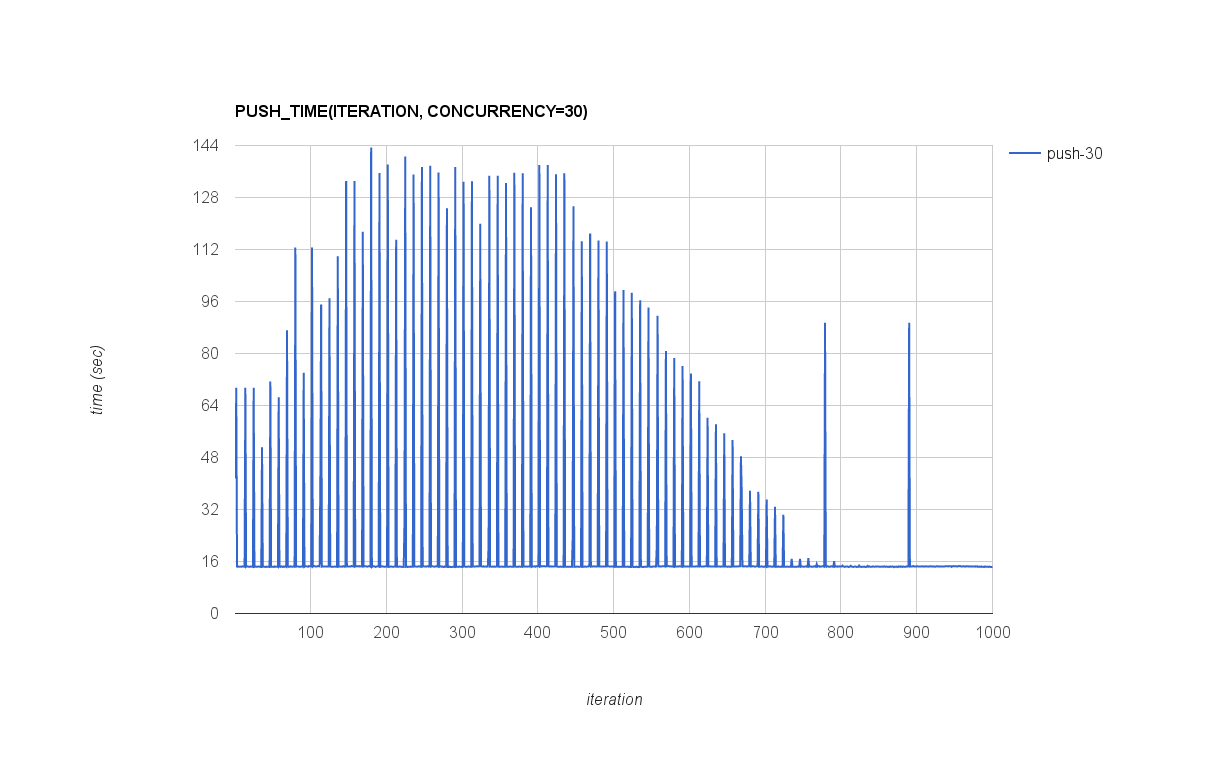
6.3.1.3.1.1. PUSH_TIME(ITERATION)
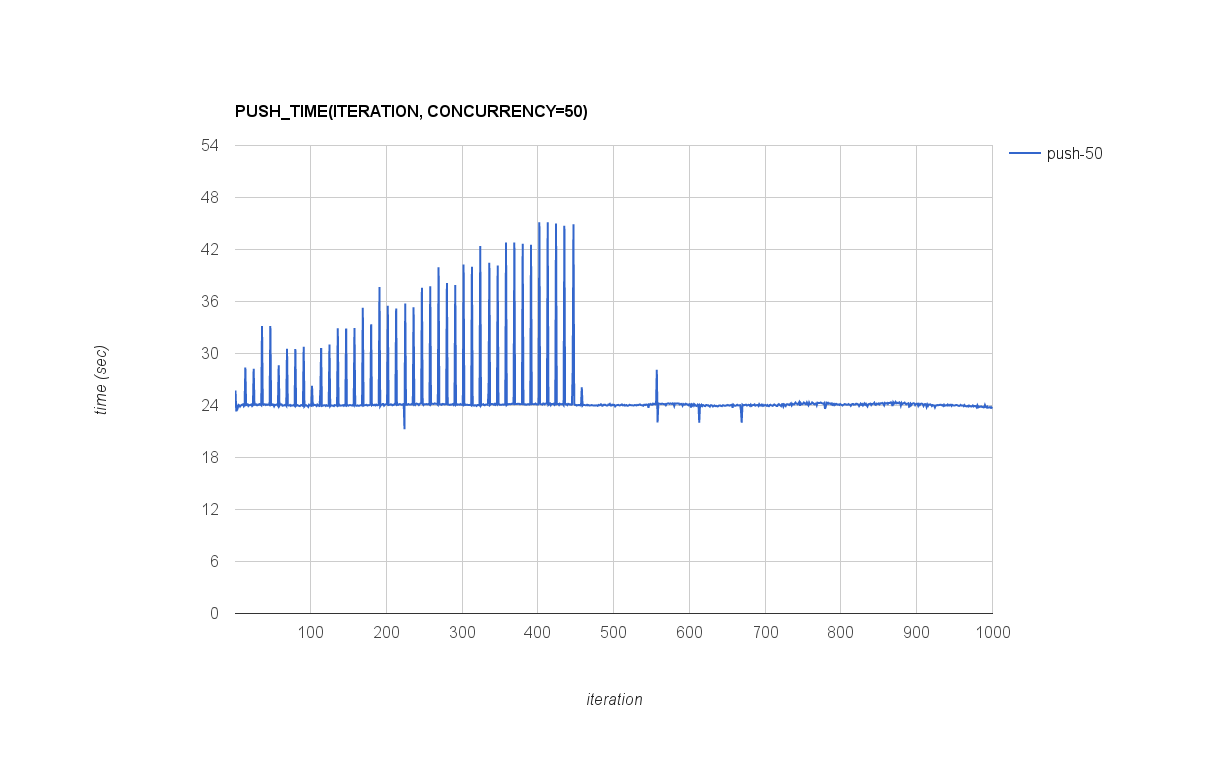
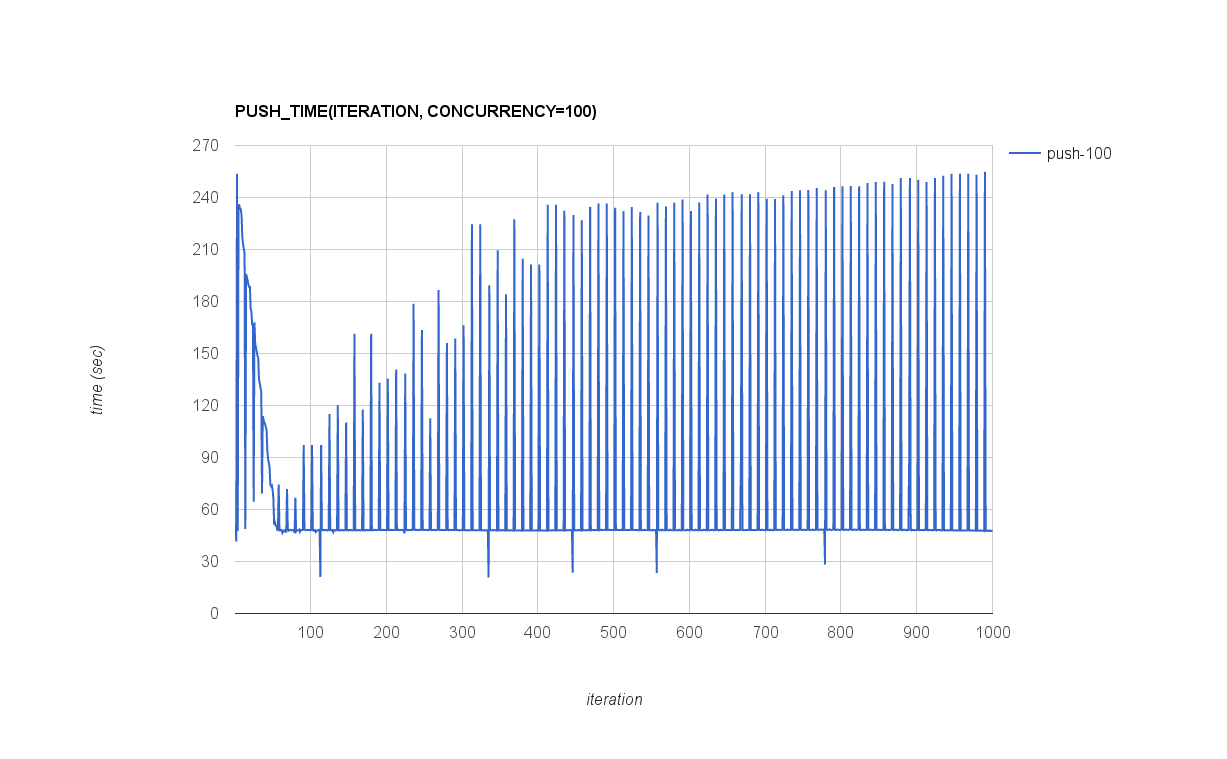
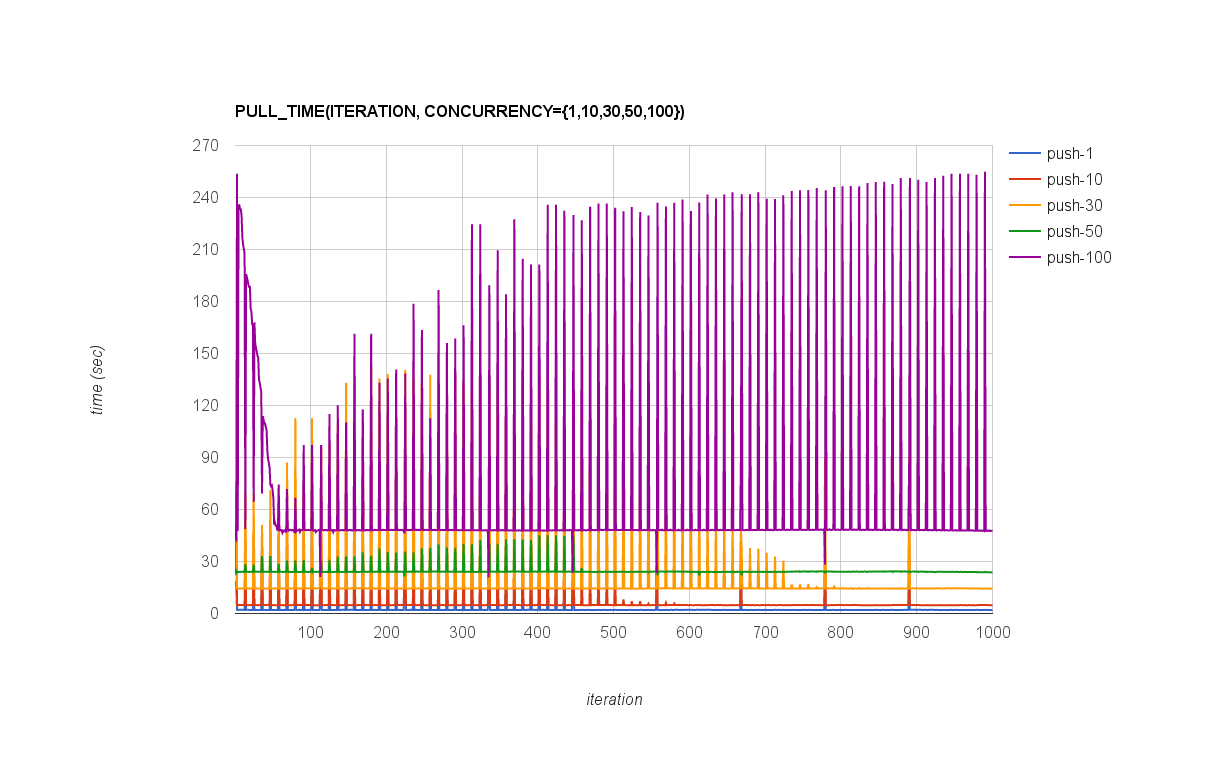
After simple processing results the following plots for push action in depend on iteration number created (click to expand an image):
6.3.1.3.1.2. PUSH_TIME(CONCURRENCY)
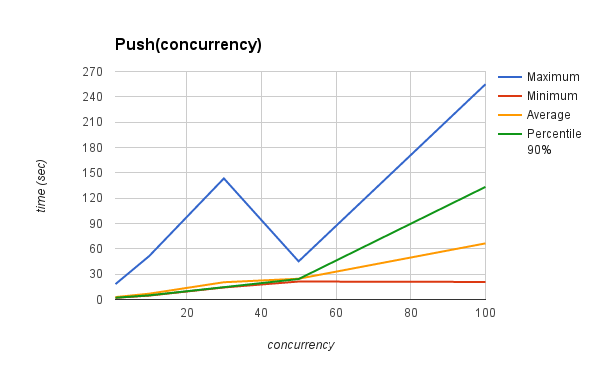
The following table and graph show how PUSH_TIME parameter depend on CONCURRENCY parameter.
| Concurrency | Maximum | Minimum | Average | Percentile 90% |
|---|---|---|---|---|
| 1 | 18.23183703 | 2.014497995 | 2.852927562 | 2.120845795 |
| 10 | 51.36455989 | 4.625913858 | 6.886669915 | 4.924576068 |
| 30 | 143.376904 | 14.23889208 | 20.4385057 | 14.57682798 |
| 50 | 45.15124679 | 21.27197409 | 24.59056571 | 24.24201851 |
| 100 | 254.9175169 | 20.78799295 | 66.44495539 | 133.36117 |
6.3.1.3.2. Pull action results
6.3.1.3.2.1. PULL_TIME(ITERATION)
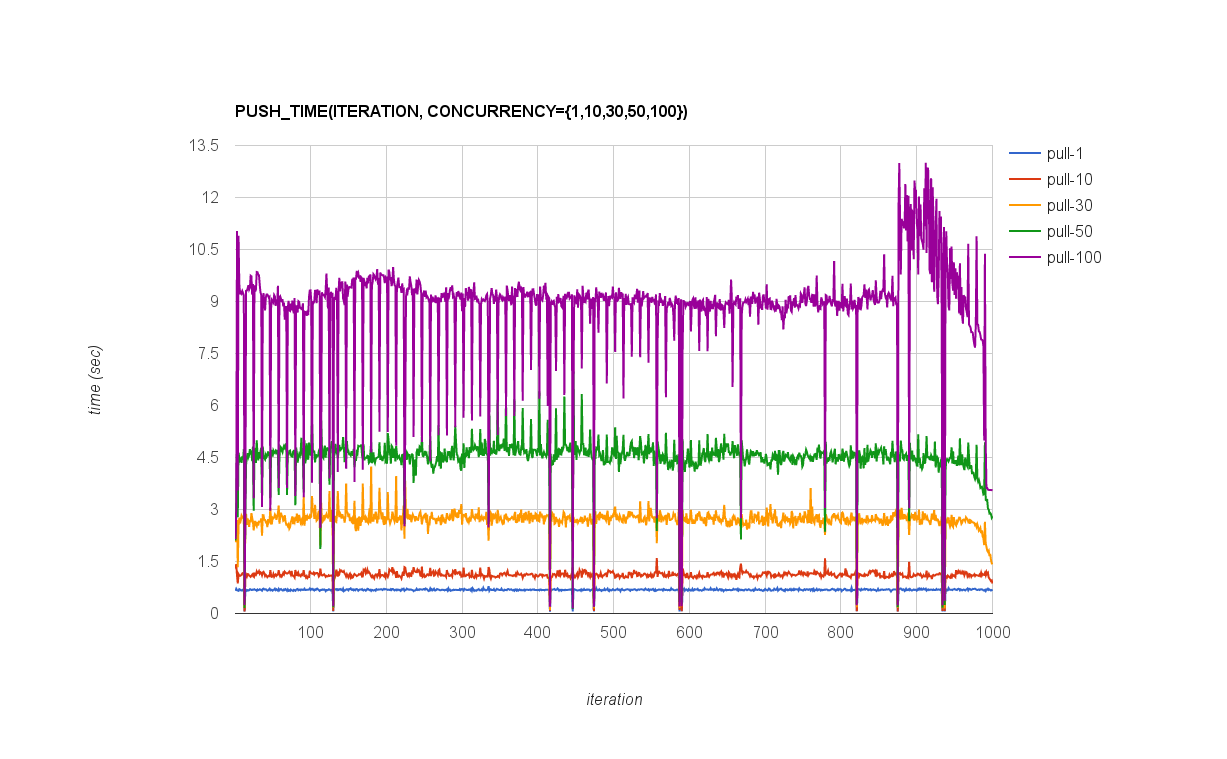
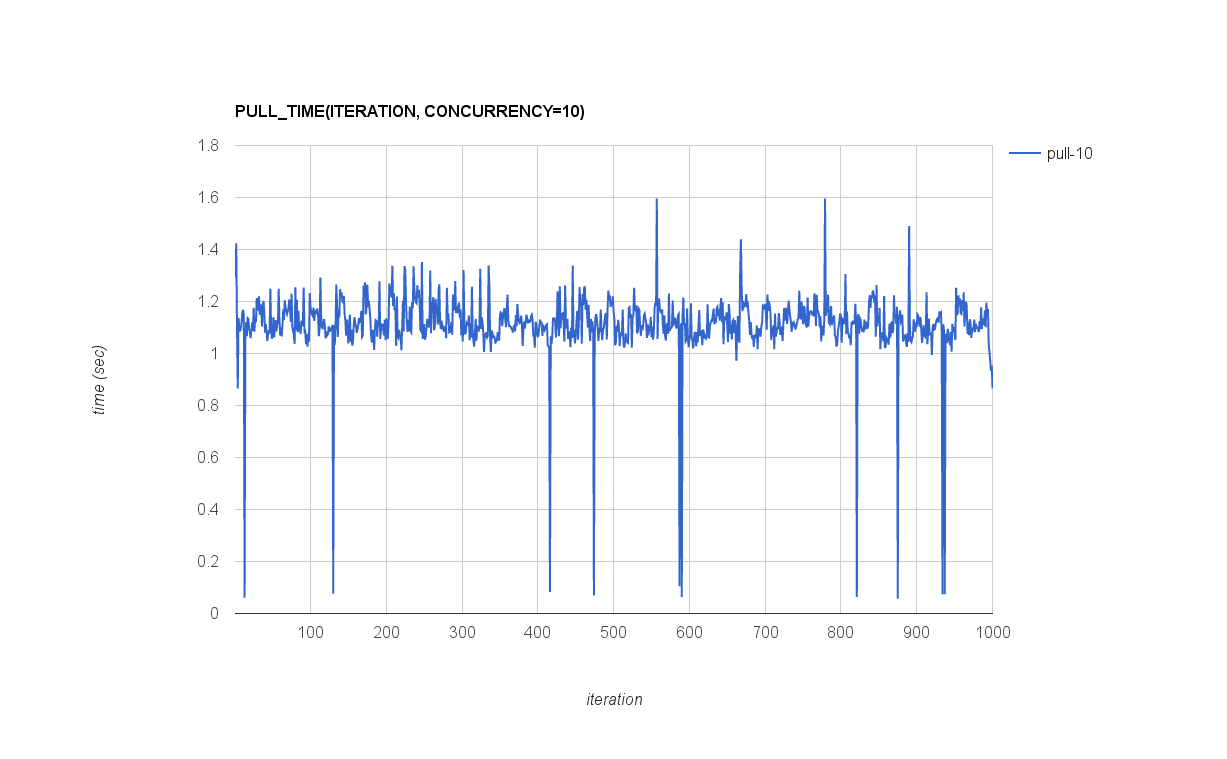
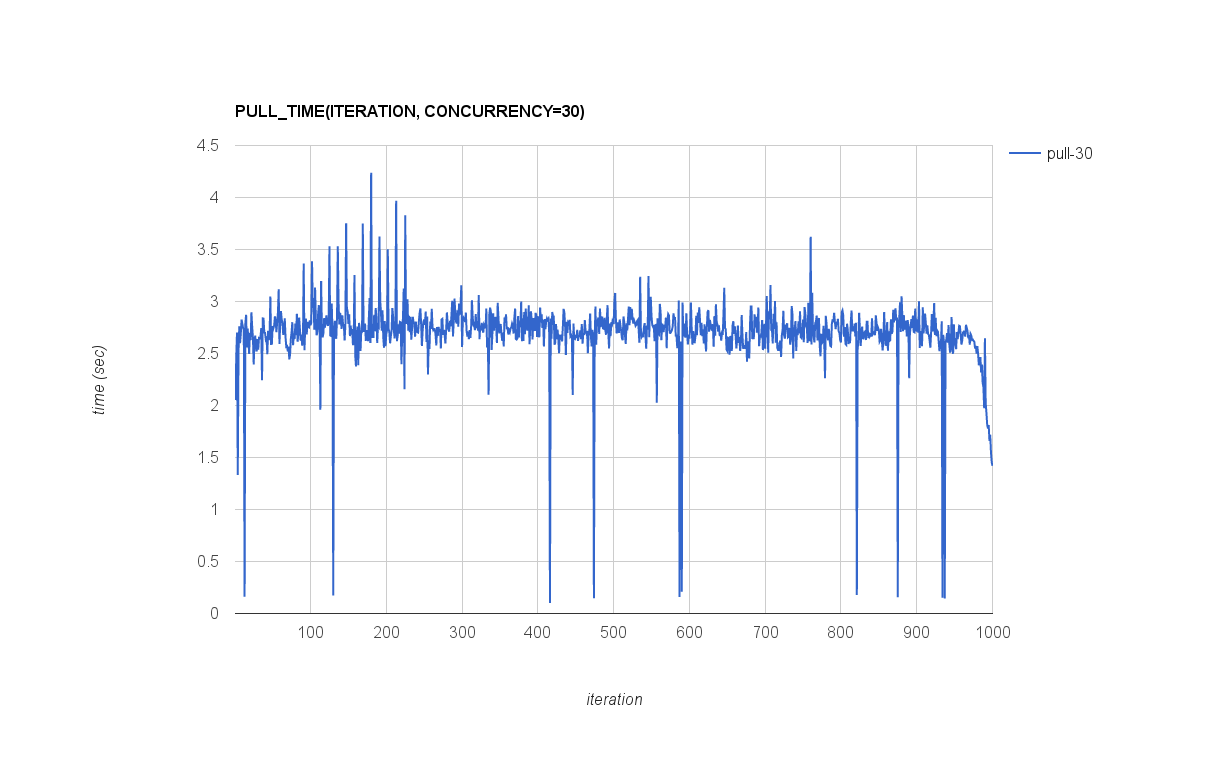
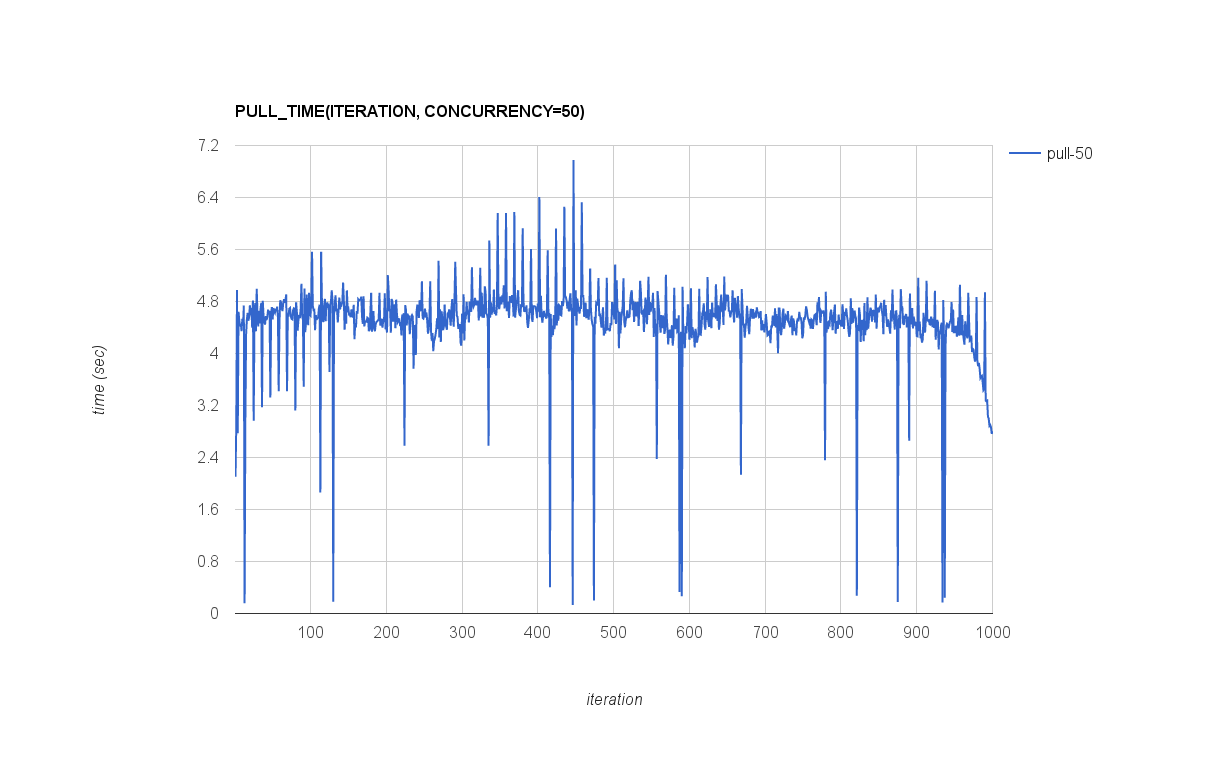
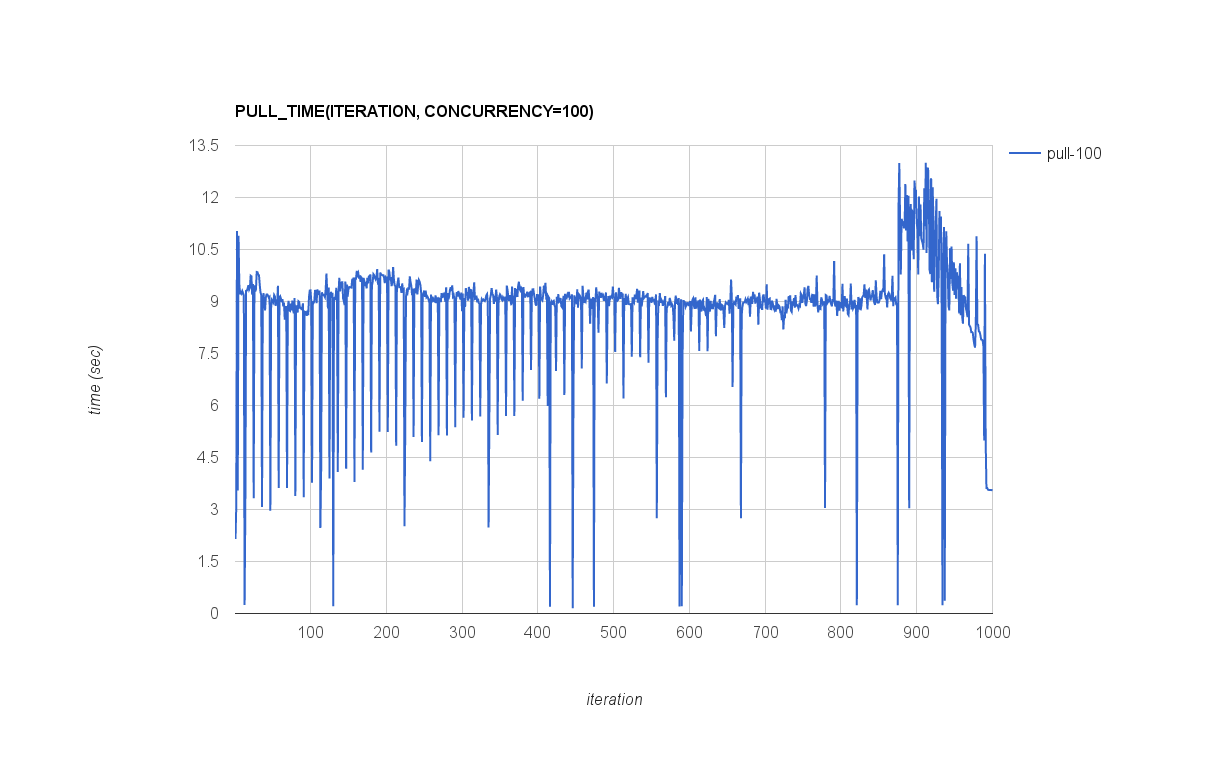
After simple processing results the following plots for pull action in depend on iteration number created (click to expand an image):
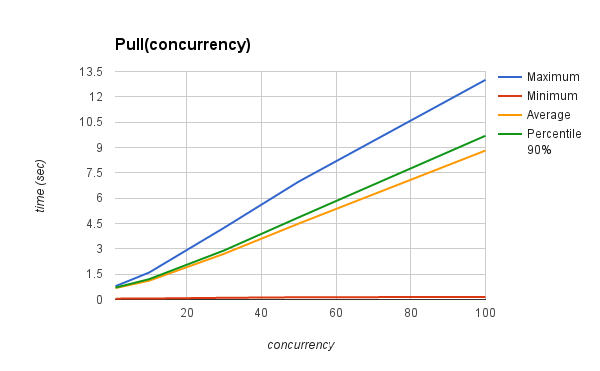
6.3.1.3.2.2. PULL_TIME(CONCURRENCY)
The following table and graph show how PUSH_TIME parameter depend on CONCURRENCY parameter.
| Concurrency | Maximum | Minimum | Average | Percentile 90% |
|---|---|---|---|---|
| 1 | 0.7883470058 | 0.05074381828 | 0.6775195916 | 0.7058973074 |
| 10 | 1.59649086 | 0.05712890625 | 1.113002464 | 1.204397488 |
| 30 | 4.239136934 | 0.1007189751 | 2.70093091 | 2.899113488 |
| 50 | 6.978290081 | 0.131428957 | 4.493998793 | 4.860594058 |
| 100 | 13.00426912 | 0.152477026 | 8.819601912 | 9.696622682 |
