5.20. OpenStack API Performance Metrics
- status
draft
- version
1.0
- Abstract
This test plan defines performance metrics for OpenStack API and the way to measure them.
- Conventions
Operation Duration - how long does it take to perform a single operation.
Operation Throughput - how many operations can be done in one second in average.
Concurrency - how many parallel operations can be run when operation throughput reaches the maximum.
Scale Impact - comparison of operation metrics when number of objects is high versus low.
5.20.1. Test Plan
This test plan defines set of performance metrics for OpenStack API. This metrics can be used to compare different cloud implementations and for performance tuning.
- This test plan can be used to answer the following questions:
How long does it take to perform a particular operation? (e.g. duration of Neutron net_create operation)
How many concurrent operation can be run in parallel without degradation? (e.g. can one do 10 Neutron net_create operation in parallel or better do them one-by-one)
How many particular operations can OpenStack cloud process in a second? (e.g. find out whether one can do 100 Neutron net_create ops per second or not)
What is the impact of having many objects in the cloud? How the performance degrades? (e.g. will the cloud be slower when there are thousands of objects and how slower will it be)
5.20.1.1. Test Environment
5.20.1.1.1. Preparation
This test plan is executed against existing OpenStack cloud.
- Measurements can be done with the tool that can:
report duration of single operations;
execute operations one-by-one and in a configurable number of concurrent threads.
5.20.1.1.2. Environment description
The environment description includes hardware specification of servers, network parameters, operation system and OpenStack deployment characteristics.
5.20.1.1.2.1. Hardware
This section contains list of all types of hardware nodes.
Parameter |
Value |
Comments |
model |
e.g. Supermicro X9SRD-F |
|
CPU |
e.g. 6 x Intel(R) Xeon(R) CPU E5-2620 v2 @ 2.10GHz |
|
role |
e.g. compute or network |
5.20.1.1.2.2. Network
This section contains list of interfaces and network parameters. For complicated cases this section may include topology diagram and switch parameters.
Parameter |
Value |
Comments |
network role |
e.g. provider or public |
|
card model |
e.g. Intel |
|
driver |
e.g. ixgbe |
|
speed |
e.g. 10G or 1G |
|
MTU |
e.g. 9000 |
|
offloading modes |
e.g. default |
5.20.1.1.2.3. Software
This section describes installed software.
Parameter |
Value |
Comments |
OS |
e.g. Ubuntu 14.04.3 |
|
OpenStack |
e.g. Liberty |
|
Hypervisor |
e.g. KVM |
|
Neutron plugin |
e.g. ML2 + OVS |
|
L2 segmentation |
e.g. VLAN or VxLAN or GRE |
|
virtual routers |
e.g. legacy or HA or DVR |
5.20.1.2. Test Case: Operation Performance Measurements
5.20.1.2.1. Description
The test case is performed by running a specific OpenStack operation. Every operation is executed several times to collect more reliable statistical data.
5.20.1.2.2. Parameters
- Following parameters are configurable:
Operation being measured
Concurrency range for concurrency dependent metrics
Objects amount upper bound for objects dependent metrics.
Degradation coefficient for each metric.
Sample size
5.20.1.2.3. List of performance metrics
Priority |
Value |
Measurement Unit |
Description |
|---|---|---|---|
1 |
Duration median |
ms |
Median of operation durations measured when operations are performed one-by-one in 1 thread |
1 |
Duration 95% percentile |
ms |
95% percentile of operation durations measured when operations are performed one-by-one in 1 thread |
2 |
Duration 99% percentile |
ms |
99% percentile of operation durations measured when operations are performed one-by-one in 1 thread |
1 |
Concurrency |
count |
How many operations can be processed in parallel without significant degradation of duration |
1 |
Throughput |
operations per second |
How many operations can be processed in one second |
1 |
Scale impact |
% |
Performance degradation measured as ratio of operation duration when number of objects is 1k versus when number of objects is low. |
5.20.2. Tools
5.20.2.1. Rally + Metrics2
This test plan can be executed with Rally tool. Rally can report duration of individual operations and can be configured to perform operations in multiple parallel threads.
Rally scenario execution also involves creation/deletion of additional objects (like tenants, users) and cleaning of resources created by scenario. All this consumes extra time, so it makes sense to run measurements not one-by-one, but grouped by resource type. E.g. instead of having 4 separate scenarios for create, get, list and delete operations have 1 that calls these operations sequentially.
To make report generation simple there is Metrics2 tool. It is a combination of python script that triggers Rally task execution and jupyter notebook which takes reports generated by Rally and calculates metrics and draws plots based on those reports. Also, before execution of metric measurements this script runs dummy scenario to ‘prepare’ deployment.
5.20.2.1.1. Rally atomic action measurement augmentation
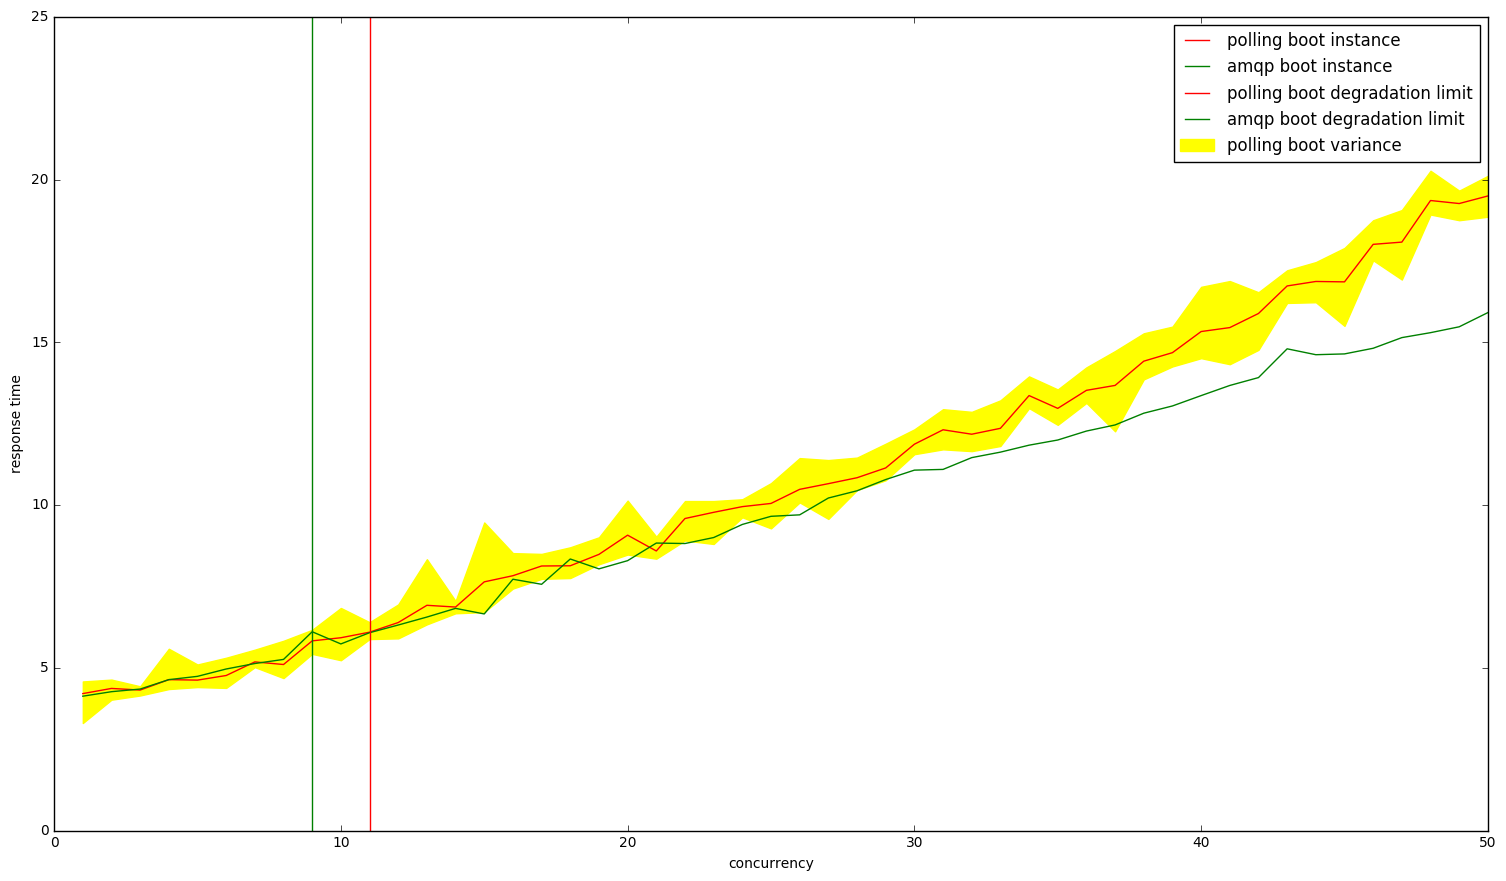
Some Rally scenarios use polling to check if the operation object is ready/active. It creates additional load on Openstack deployment, so it was decided to fork Rally and use amqp events as a way to get more reliable atomic action measurement. It was done using Pika however results have shown, that in most cases atomic action time of operation measured with amqp is in variance range of time measured with polling and the difference is noticeable only when degradation of operation itself is very high. Plot below shows that difference. Vertical lines mark the 1.5 degradation point.
5.20.2.1.2. Scenarios
- To perform measurements we will need 2 types of scenarios:
cyclic - sequence of create, get, list and delete operations; total number of objects is not increased.
accumulative - sequence of create, get and list operations; total number of objects is increasing.
- Scenarios should be prepared in following format:
Constant runner with times field set to ‘{{times}}’ and concurrency to ‘{{concurrency}}’.
It’s better to turn off SLA, so it won’t mess with the Metrics2 report compilation later.
Example:
{
    "Authenticate.keystone": [
        {
            "runner": {
                "type": "constant",
                "times": {{times}},
                "concurrency": {{concurrency}}
            },
            "context": {
                "users": {
                    "tenants": 2,
                    "users_per_tenant": 3
                }
            }
        }
    ]
}
5.20.2.1.3. Duration metrics
Duration metrics are collected with help of cyclic scenario. However they are part of concurrency metrics, only with concurrency set to 1.
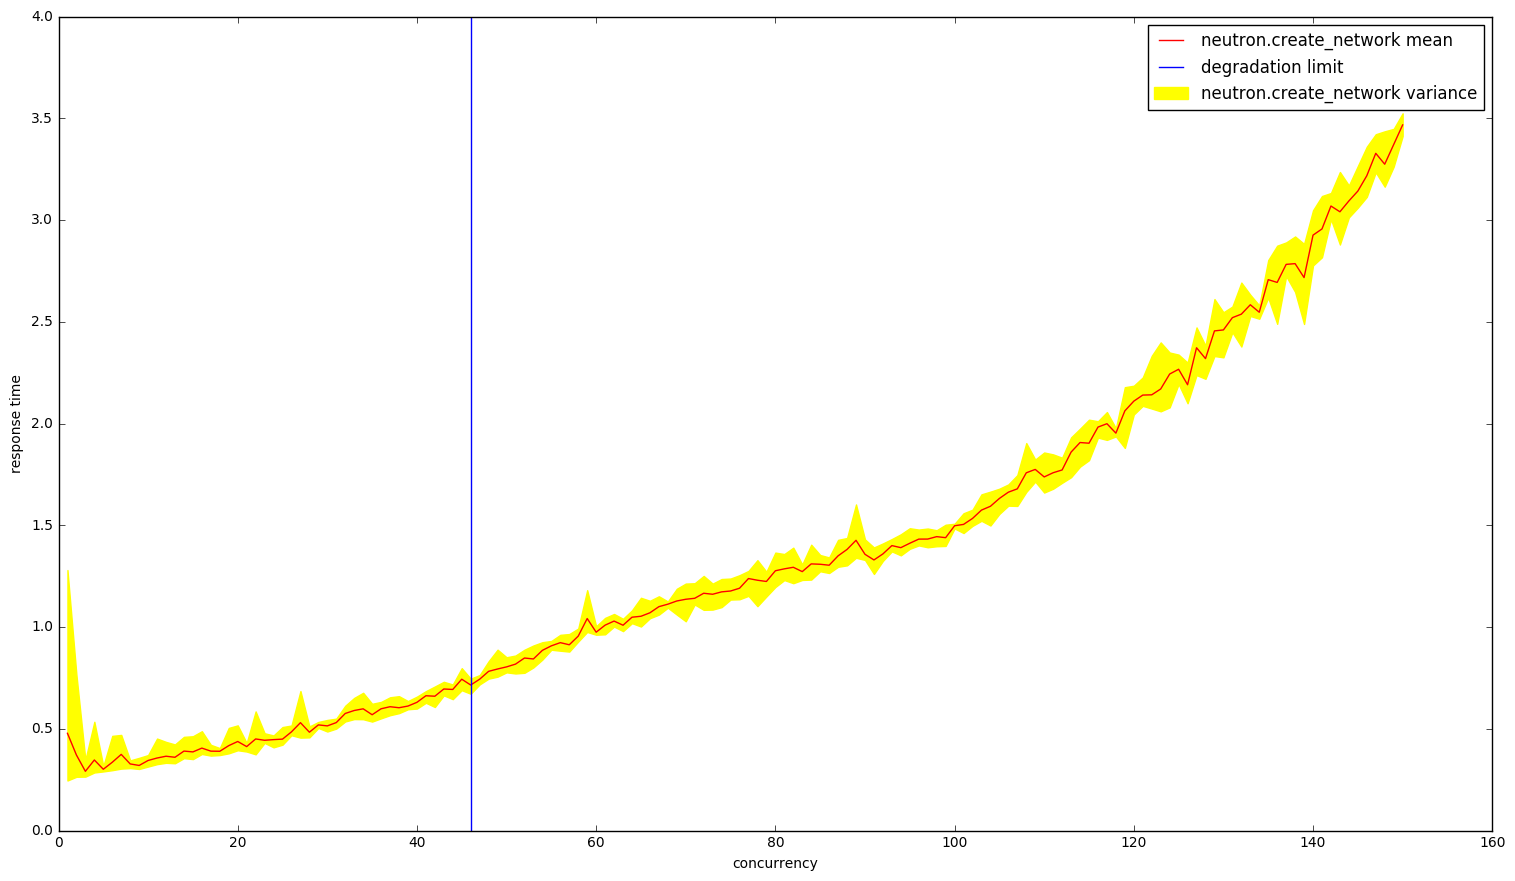
5.20.2.1.4. Concurrency metrics
These metrics are collected with help of cyclic scenarios.
- Actions:
- For each concurrency value x from defined concurrency range:
Run scenario N times, where N is large enough to make a good sample. Collect list of operation durations.
Calculate atomic actions duration mean and variance.
Find first concurrency value where duration mean exceeds base value times degradation coefficient for each atomic action.
Generate plot.
Important note, that this metric is actually a monotonic function of concurrency and can be calculated using binary search for example.
Example report:
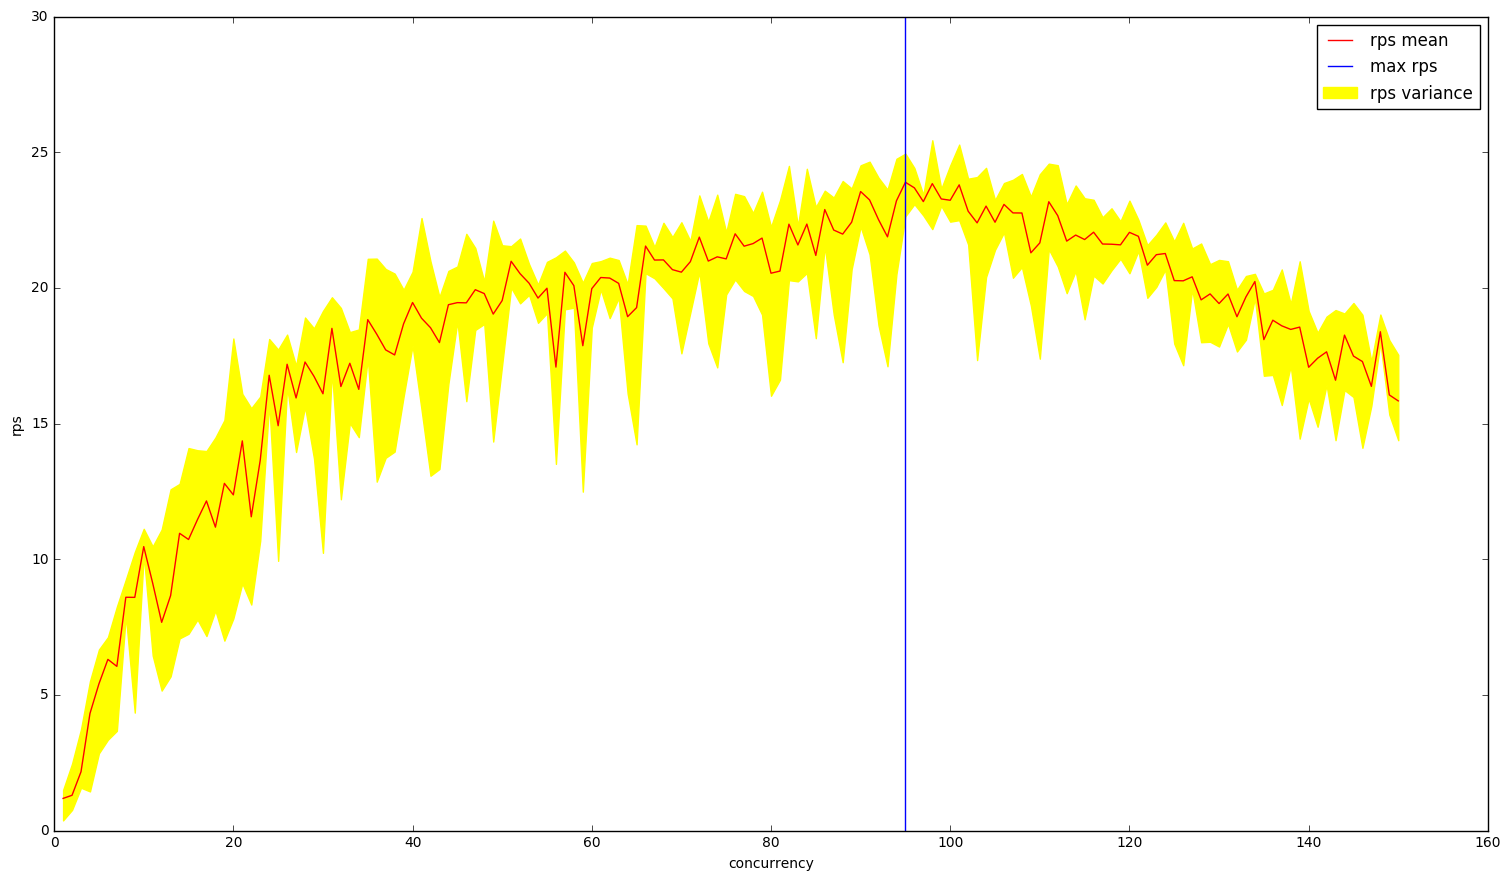
5.20.2.1.5. Throughput metrics
These metrics are collected with help of cyclic scenarios.
- Actions:
- For each concurrency value x from defined concurrency range:
Run scenario N times, where N is large enough to make a good sample. Collect list of operation durations.
Calculate requests per seconds, using ‘load_duration’ value from Rally reports. Divide load duration by concurrency to get RPS.
Find concurrency value, where RPS has its peak.
Generate plot.
This metric usually has a bell-like behavior, but not always, so it must be calculated in linear time across all the points in concurrency range.
Example report:
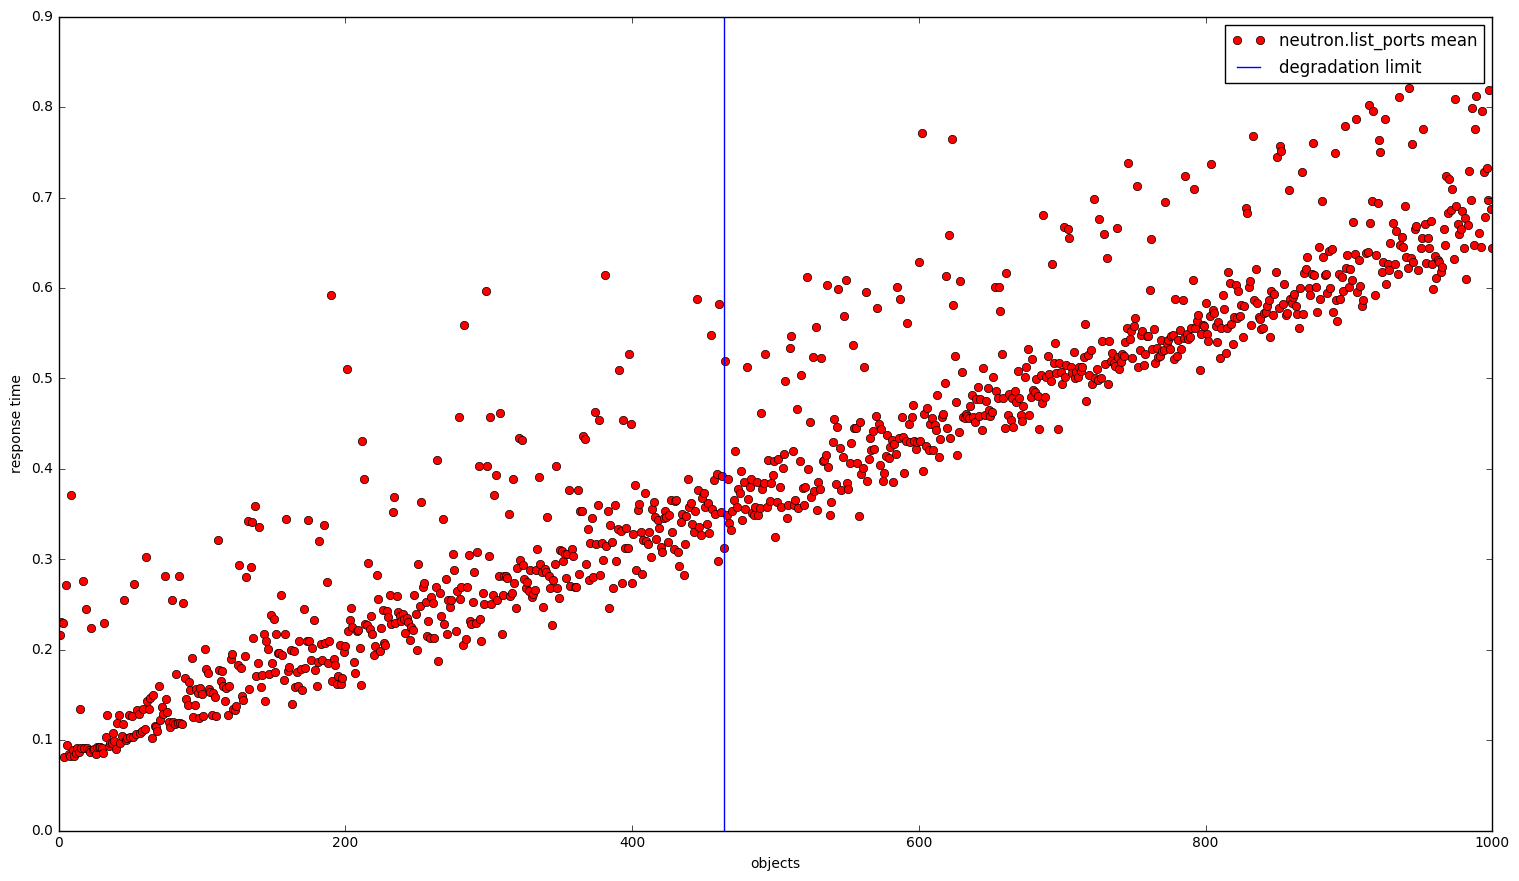
5.20.2.1.6. Scale impact metrics
These metrics are collected with help of accumulative scenarios.
- Actions:
Set concurrency to low value, like 3. The reason for this is that it won’t affect metric measurement, but will speed up report generation process.
Run scenario until upper bound value of objects reached (e.g. 1 thousand).
Find first amount of objects value, where degradation of duration operation exceeds defined value.
Generate plot.
Example report:


